


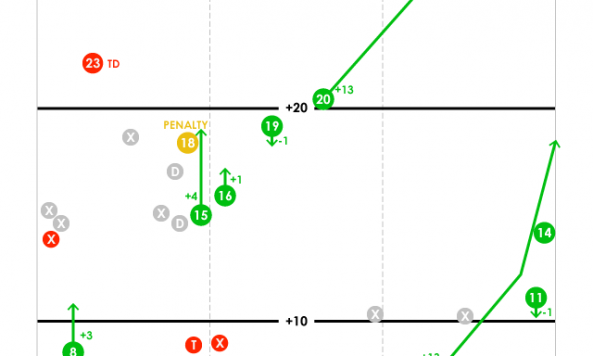
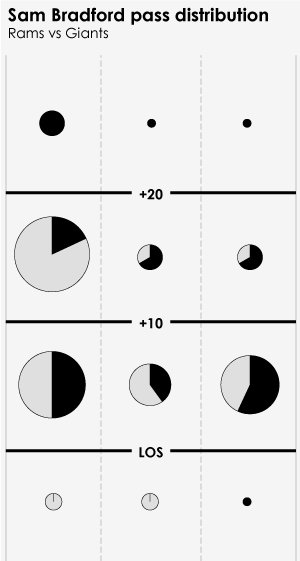
This chart shows where receivers were standing when Bradford’s passes arrived, and how many were completed by zone.
Sam Bradford’s passing day in Week 2 was equal parts thrilling and maddening – he set a new personal best in yardage, but fell below the 50% completion rate for the first time as a pro. He did an excellent job of identifying blitzes and changing his protections, but struggled when the four-man rush applied pressure. If you look only at Bradford, that’s what you see.
But if you take the bird’s eye approach, and dissect how McDaniels game-planned to attack the Giants’ defense, an enlightening pattern emerges.
Back in the offseason, we looked at how McDaniels’ offenses stretch the field, and compared the Rams’ pass distribution to that of the Broncos. For fun, we also looked at the new-look 2010 Patriots and their two-TE offense.
One of the surprises of that exercise was how closely aligned Shurmur’s Rams were with Tom Brady’s Patriots in terms of target distribution, with a huge percentage of passes going to the short middle. The Broncos, by comparison, spread the ball out much more equitably among the six primary zones in front of the quarterback.
After drafting Lance Kendricks, there was talk that McDaniels might try to emulate the 2010 Pats. But if Monday’s game is any indication, expect much more of a Broncos-like attack. Fantasy prognosticators, take note of how often Mike Sims-Walker and Brandon Gibson were targeted between 10 and 20 yards out from the line of scrimmage. Both could fill that coveted “Brandon Lloyd” slot. Meanwhile, Danario Alexander is in a category all his own in the 20+ yard “big play” territory.
One unknown is how much the potential return of Danny Amendola, Sam Bradford’s security blanket, could skew this distribution back toward the short middle. But if Bradford continues to pepper the intermediate zones, it should be a win-win for everybody as holes are created all over the field.
After the jump, we go in-depth and show every target, every drop, and every run after the catch, between the 20s and in the red zone. Enjoy.