| 2009 | 2010 | Improvement | |
|---|---|---|---|
| Points Scored | 175 | 289 | +114 |
| Points Allowed | 436 | 328 | -108 |
The stats say the offense and defense both improved dramatically in 2010. So why does WPA favor the D?
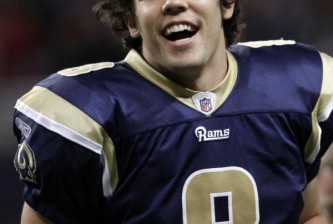
2010 saw the Rams take a huge leap forward in respectability on both side of the ball, jumping from one win to seven and immediate contention in the weak NFC West. While rookie Sam Bradford won accolades (and endorsement deals) for revitalizing the franchise, several statistical measures of the Rams are telling us to look elsewhere for the source of the Rams’ improvement.
The offense improved by 114 points with Bradford at the helm, and little else changed. The defense improved by 108 points after a reshuffling of the defensive line. Seemingly, both sides of the ball should be credited relatively equally in the improvement of the team’s fortunes. However, Win Probability analysis by Brian Burke of Advanced NFL Stats says differently.
By his metrics, Bradford’s exploits over 16 complete games started amounted to 0.09 win probability added, 25th among quarterbacks.
Seem unbelievable? Consider the Football Outsiders’ quarterback stats a form of corroboration, if not a complete explanation. By their measure, Sam Bradford rated 34th among NFL quarterbacks in their leading metric — DYAR, or “defense-adjusted yards over replacement.” (Dan at Falcoholic.com offers a nice explanation of DYAR, including its inherent weakness, understanding what constitutes a “replacement player.”)
The offense as a whole totaled only 1.19 WPA. The driving force behind the Rams’ six-win improvement, according to Burke’s WPA, was the defense. The players listed by the metric totaled 13.89 WPA.
Yes, I realize that 1.19 + 13.89 doesn’t add up neatly to 7 wins. And no, I’m not sure why. But the important thing for us to notice is the staggering difference between the two units. Why is the defense getting so much credit in this stat? Because that’s exactly the way Spagnuolo played it.
Brian Burke recently wrote a post explaining his Win Probability Added stat in full, which is worth a read if you want to understand the methodology without a deep dive into the math. The most telling statement, though, is this:
WPA is very sensitive to the context of the game. That same interception that cost -0.08 when a team was down by 7 points in the 2nd quarter would cost much more if it the offense was leading by a point late in the 4th quarter.
As anyone can tell from watching the season, it was very rare that Spagnuolo asked his offense to make plays in the fourth quarter to win games. The Rams were much more content to do their work on offense in the first 30 or 40 minutes, then basically hand the game over to the defense and say “win this one for us.”
In fact, only twice by my recollection — in the wins over San Diego and Denver — did the offense have to mount a 4th quarter scoring drive to earn the game-winning points, and even in those two occasions, it was the defense who made the last meaningful stand. So naturally, they’ll be earning more credit via this WPA metric.
Understanding how important the Rams’ defense was to this season, then, let’s take a look at the most valuable players to the Rams, as defined by WPA:
Defense
- 1.99 – LB James Laurinaitis (7th among all NFL LBs)
- 1.25 – DE Chris Long (8th among all NFL DEs)
- 1.05 – S Craig Dahl
- 1.04 – S Oshiomogho Atogwe
- 1.04 – DE James Hall
- 1.03 – CB Bradley Fletcher
- 0.88 – DT Fred Robbins
No surprise at the top of the rankings, with “Super Sophomore” Laurinaitis and much-improved Chris Long at the top of the rankings. But it’s interesting, and gratifying, to see Dahl, Atogwe and Bradley Fletcher ranked so high.
Offense
- 0.54 – WR Danario Alexander
- 0.37 – WR Brandon Gibson
- 0.28 – WR Mark Clayton
- 0.18 – TE Billy Bajema
- 0.16 – RB Ken Darby
- 0.15 – TE Daniel Fells
Amazingly, since WPA is considered to be a cumulative stat, (though negative plays accrue as well), many of the offense’s best players in the clutch were those who saw the field the least. Danario saw only 215 snaps, Mark Clayton only 273, and Ken Darby only 201. Combined that barely measures 60% of the 1134 snaps Bradford took, and yet they are all considered to have made more significant plays that led to Rams wins — and avoided significant mistakes that led to Rams losses.
Take all this with a healthy shakerful of salt. No stat is perfect in its approximation of a player’s value to the franchise. But rather than use this to take any shine away from Bradford’s immense potential and his revitalization of the Rams, it helps us credit the accomplishments of several of his teammates.
It will also be interesting to compare how these stats look a year from now, with Bradford in his second season, working with a new offensive coordinator who will demand more from his QB — and having faced a much tougher schedule that won’t allow the Rams to coast in many fourth quarters.

